


Breaking Russian myths about Ukraine: infographics of 1914-1919

Ukraine in the world archives: Breaking Russian myths in infographics of 1914-1919
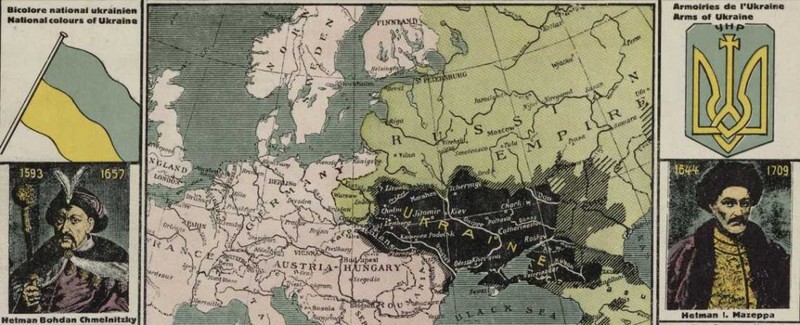
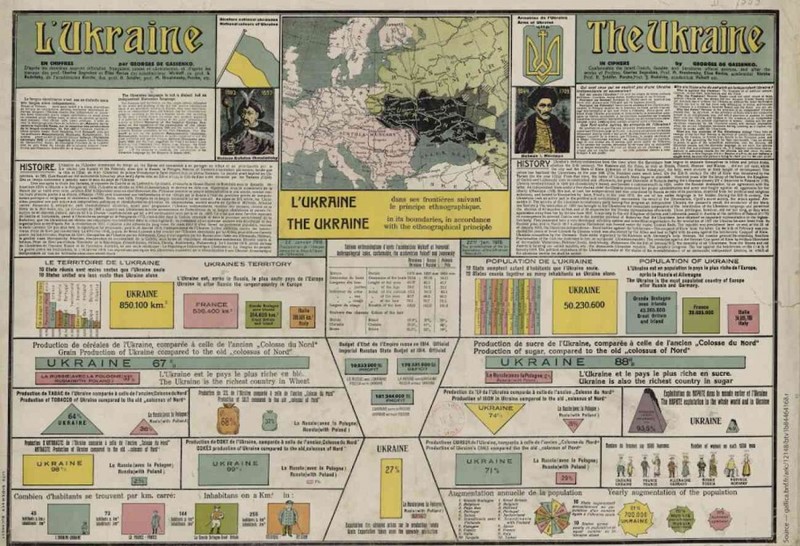
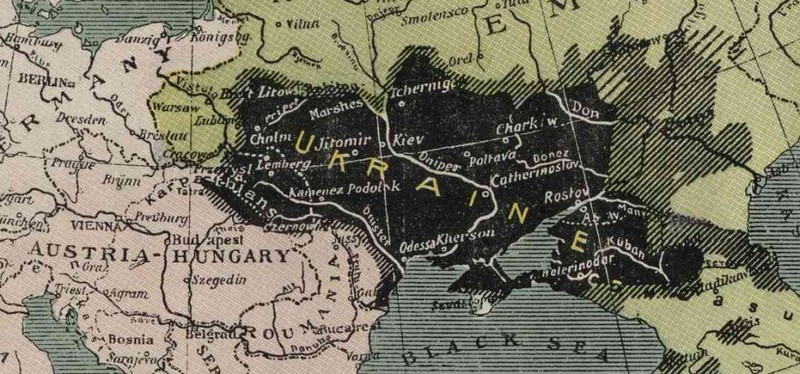
Lenin was right when he said that «Soviet Russia can’t exist without Ukraine». Breaking Russian myths and perversion of information: in 1918, Ukraine (UPR) proclaimed that it separates from Russia and becomes an independent state. To tell the world about a new country UKRAINE, Bucharest published a colorful poster infographics, which tells about Ukrainian history, language and economy in English and French. It is beautifully illustrated with the map of Ukrainians resettlement, national symbols and portraits of hetmans Bohdan Khmelnytsky and Ivan Mazepa.
Ukraine borders according to the ethnographic principle, Yuri Gasenko, 1919, SIBER & Co, BUCHAREST
The original of this poster from «Gallica» collection is located in the French National Library (Bibliothèque nationale de France). Author Yuri Gasenko (Ukrainian Юрій Гасенко; 1894-1933) is a Ukrainian statesman and public figure, writer and journalist, diplomat of emergency issues and plenipotentiary of Ukraine in Romania – the question of emergency and plenipotentiary of Ukraine in Romania, in 1919 designed and published the infographics of Ukraine, where foreign readers can find short and accessible history of Ukraine: from the age of Kiev Rus to the proclamation of independence in 1918.
Interesting abstracts from the review of the Ukrainian Republic: its history, its geography and its economic life in 1914.
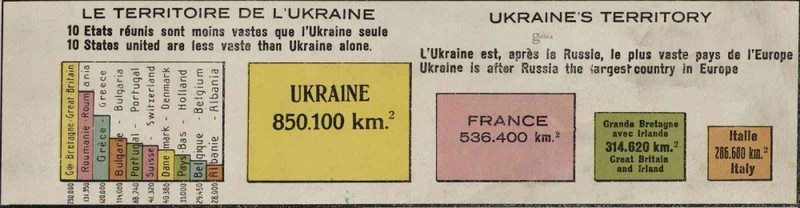
Ukraine’s territory was much bigger than now:
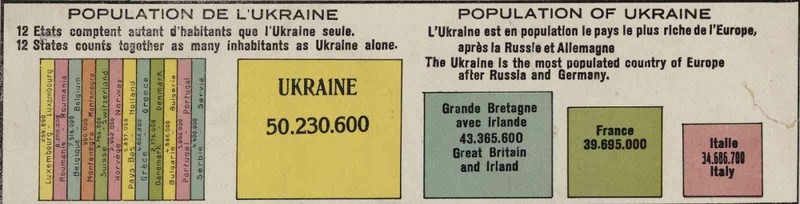
Area – 850.100 km2. This is more than the United Kingdom (obviously, we are talking only about the island of Great Britain), Romania, Greece, Bulgaria, Portugal, Sweden, Denmark, the Netherlands, Belgium and Albania together. It’s also larger than France and Italy. The territory of modern Ukraine is 603.628 km2 (233,062 sq mi).
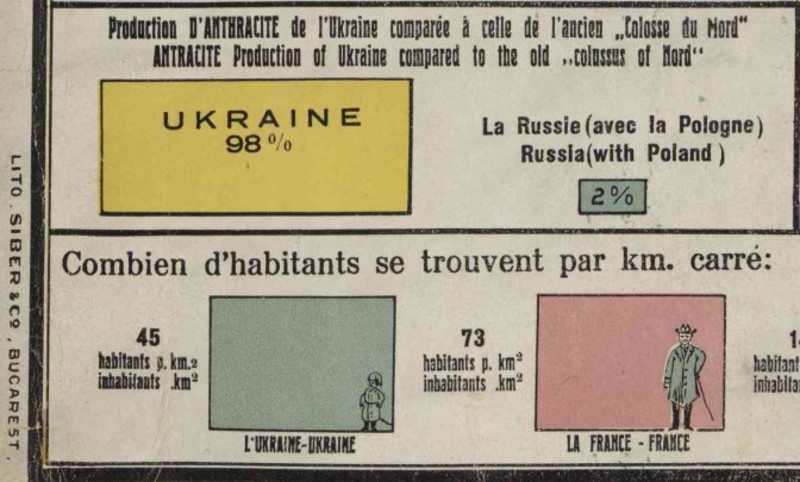
The population was 50.2 million people (now – 43 million, 45 million, taking into account temporarily occupied the Crimea and Sevastopol). But the population density is quite low – 45 people per km2. In comparison, France – 73 persons, Belgium – 255.
In the 19th century, Ukraine was the agricultural and industrial giant.
Even as a colony of the Russian Empire, Ukraine produced and grew:
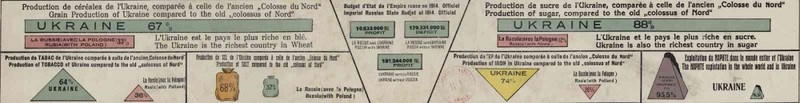
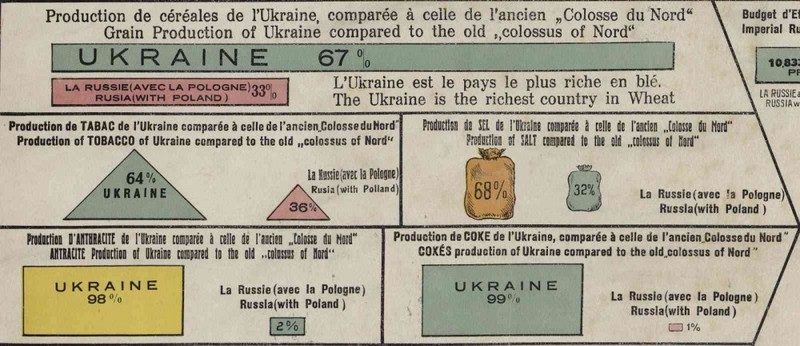
- 67% of Russian grain (wheat – more than anyone else in the world),
- 64% of the Russian tobacco,
- 98% of anthracite,
- 68% of salt,
- 99% of carbonite,
- 88% of sugar (Ukraine produced more than all the world’s sugar),
- 74% of steel,
- 71% of coal,
- 4.5% of the world’s oil.
Ukraine production in comparison with the Russian Empire (in percentage correlation):
Ukraine
- Production of iron - 74 %
- Production of sugar - 88 %
- Production of coal - 71 %
- Production of carbonite - 99 %
- Production of anthracite - 98 %
- Production of tobacco - 64 %
- Production of grain - 67 %
- Manufacture of salt - 68 %
- Exports from grain production - 27 %
Russian Empire
- Production of iron - 26 %
- Production of sugar - 12 %
- Production of coal - 29 %
- Production of carbonite - 1 %
- Production of anthracite - 2 %
- Production of tobacco - 36 %
- Production of grain - 33 %
- Manufacture of salt - 32 %
- Exports from grain production - 1 %
If in 1914 Ukraine would have been an independent state, Ukraine’s budget revenues would amount to 181.244 million rubles, and Russia: 10,833,000 rubles (with a deficit of 170,331,000 rubles)…
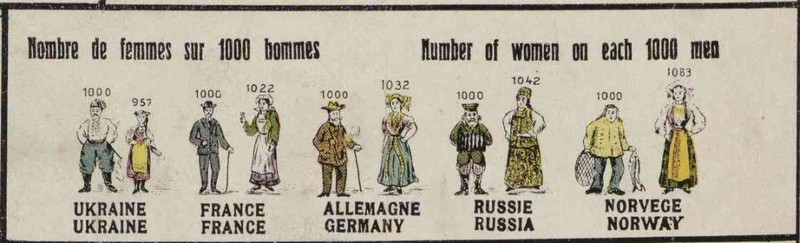
The author even added data on physique and hair color of Ukrainians, Russian and Poles (apparently he decided that foreigners need to know about that).
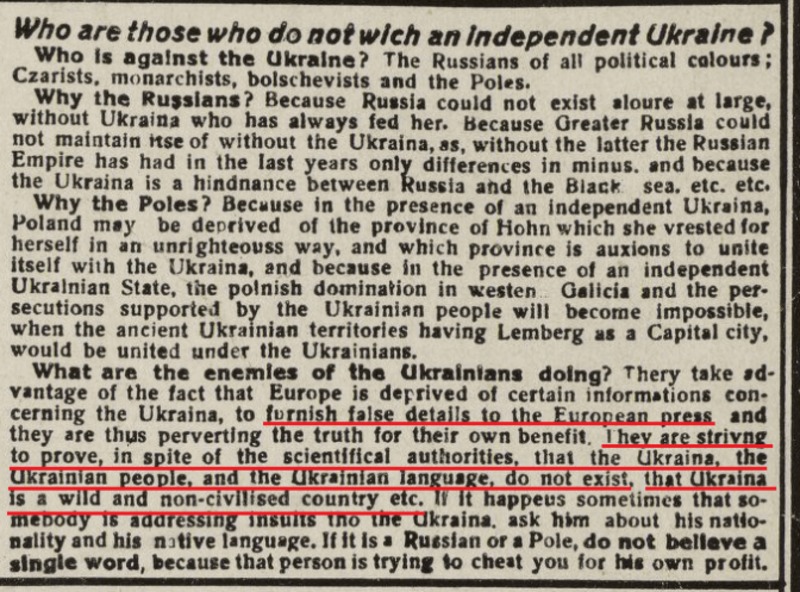
Author also emphasizes the fact that neither Russia nor Poland does not want Ukraine to be independent, and is trying to prove in the European media that Ukrainian people and the Ukrainian language does not exist, that the Ukraine is barbaric country. According to the behavior of modern Russian media, Russia has not changed over the past 100 years.
Lenin was right when he said that «Soviet Russia can’t exist without Ukraine». Let’s read some extracts from the complete set of works (Volume 40): «Losing Ukraine is like losing your head!». «Now, with the conquest of Ukraine … our strength is growing. Now we have the opportunity to receive fuel from the Donets Basin, there are sources of bread and food… There are huge stocks and surplus of bread in Ukraine, it’s difficult to take them all – there are still partisans there…» (Volume 38, pp. 300-305). Muscovy (RE, the USSR, the Russian Federation) has always lived at the expense of the Ukrainians, both in material terms and in the spiritual and personnel. Therefore, the war against Ukraine, that Moscow started, is a question of survival of the Russian Empire. Clinch of Russian-Ukrainian war will not leave a stone upon another in the current fake project called «Russian Federation» and in sham non-ethnic «Russians» community.
Thanks to Russian opponents who likes to shout «It’s a fake. There was no such thing as infographics in those years!!!». It’s a shame to be uneducated, lazy and slow-witted. INFOGRAPHICS (from the Latin word informatio – awareness, clarification, presentation, and ancient Greek γραφικός – written from γράφω – to write) – one of the forms of information design, graphical way of presenting information, data and knowledge, the goal of which is to present complex information quickly and accurately. Founder of infographics was Scottish engineer and political economist William Playfair applied his innovation in Commercial and Political Atlas in 1786 for the first time:
- The Commercial and Political Atlas: Representing, by Means of Stained Copper-Plate Charts, the Progress of the Commerce, Revenues, Expenditure and Debts of England during the Whole of the Eighteenth Century, 1786.
- Statistical Breviary; Shewing, on a Principle Entirely New, the Resources of Every State and Kingdom in Europe, 1802.
- A Statistical Account of the United States of America by D. F. Donnant. London: J. Whiting. William Playfair, Trans, 1805. (Statistical report of the United States of America).
- An Inquiry into the Permanent Causes of the Decline and Fall of Powerful and Wealthy Nations: Designed To Show How The Prosperity Of The British Empire May Be Prolonged, 1807 (the question about causes of the recession and loss of power and wealth of nations).
Infographics is not a modern invention, its convenience was appreciated a hundred years ago. One of the old visualizations is about Ukraine.


Comments